
The test statistics and its application in industry
The accuracy of the outcomes can be analyzed with massive ease and swiftness through a test statistic calculator. After gathering the research study data, the essential task is to deal perfectly with this vast data. The statistical tools help in worthy management. Get the instant results for f value through accessing the online tool! The standardized test statistic calculator is a simple way to test the statistical data and their outputs.
Hypothesis for the research may be an alternative hypothesis or Hypothesis for the research may be an alternative hypothesis or null hypothesis. The test value is such as a line responsible for dividing the distribution graph into a variety of sections. These sections indicate the rejection regions. The test value is a great source which helps in the determination of null and alternative hypotheses. Test statistic calculator,helps in making calculations for the rejection or acceptance of the hypothesis.
How to conduct statistical tests?
The user has to go through the drop-down menu for making a selection of test values for T. Afterwards, add the value for the degree of freedom and significance level in the online P value calculator, and you are all done with your inputs. It helps in the calculation of test value for T for two-tailed and right-tailed ones.
Compare the test statistics for the null hypothesis and the alternative hypothesis for the test distribution.Make scientific studies and research easier using smart tools like test statistic calculator.The calculation through an online tool is convenient to do as it does not demand the formulas. The standard formula that helps the statisticians for calculating the T test value is given as:
t = [ x – μ ] / [ s / sqrt( n ) ]
Here, the population's sample size is reflected through "n", and the sample mean is reflected through "x". However, s and μ are the standard deviations for the sample and population mean, respectively.
Practical example of Test statistics:
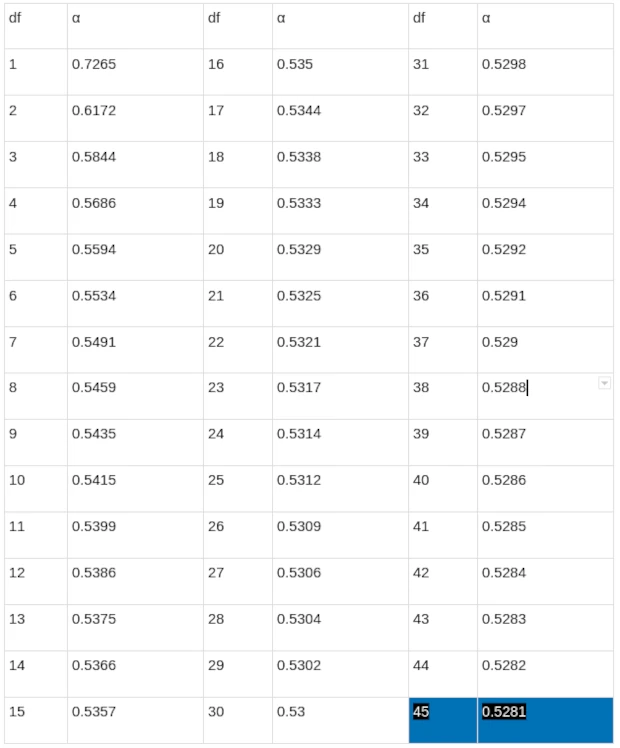
Let's compute the statistical data with a significance level between 0 to 0.5 and the degree of freedom is 45.Then use the test statistic calculator to evaluate the result.
T Value for Right Tailed Probability
0.5281
T Value for Left Tailed Probability
- 0.5281
T Value for Two Tailed Probability
± 1.0485
One Tailed Probability of 0.3
Conclusion
The statistical tools help in worthy management. Get the instant results for f value through accessing the value of the test statistic value calculator. Compare the test statistics for the null hypothesis and the alternative hypothesis for the test distribution.
Loading comments...


