Here’s a report that confuses a lot of people.
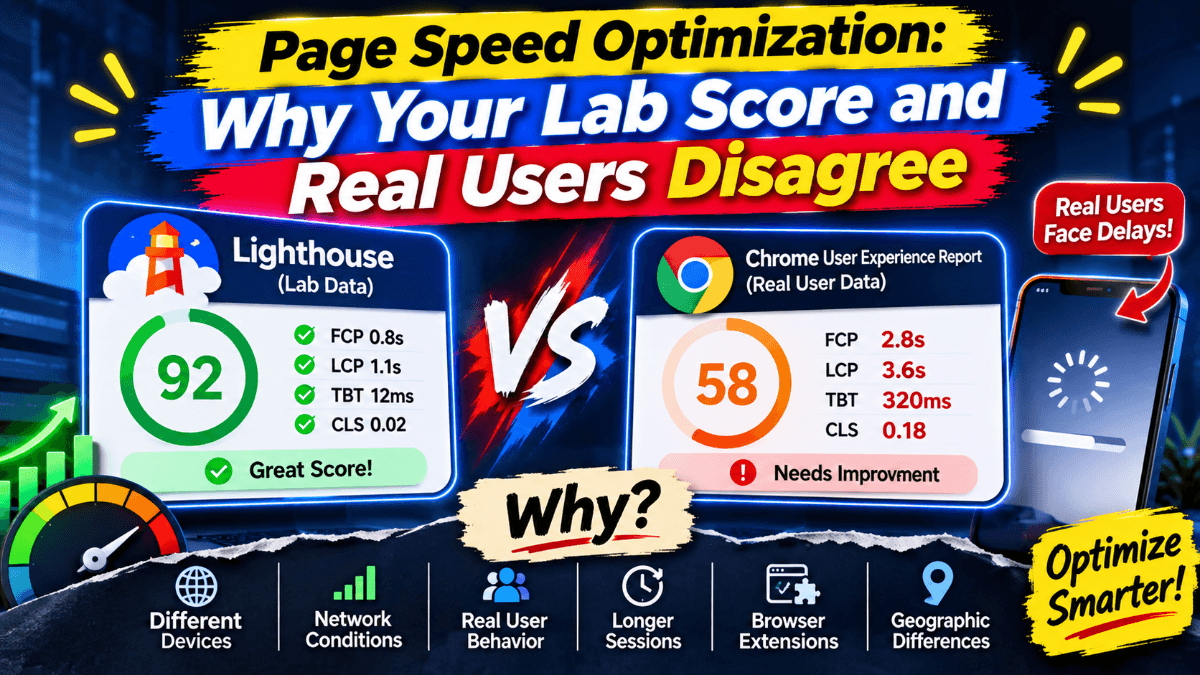
You open Google PageSpeed Insights, and the top of the report says “Core Web Vitals Assessment: Failed”.
Scroll down, and Lighthouse gives the same page a green performance score.
Neither number is wrong. They answer different questions.
The assessment comes from your real Chrome visitors over the past 28 days. The score comes from one simulated page load on one emulated phone.
Page speed optimization often goes wrong right here. You chase the score you can move in an afternoon, and your field result stays red.
We built a small test page to see how wide that gap can get. Lighthouse scored it 100 in five runs out of five.
Then a scripted visit scrolled to the bottom and tapped one button.
It got a Cumulative Layout Shift of 0.265 and an Interaction to Next Paint of 600 ms, both in the poor range.
Below, you’ll see why the lab and the field disagree, which two metrics a page load can’t see, and how to confirm that a fix worked.
Lab Data vs Field Data in PageSpeed Insights
PageSpeed Insights puts two kinds of data in one report, and you need to know which is which.
Lab data is a controlled test. Lighthouse loads your page once, on an emulated phone, with a throttled network and a slowed-down processor.
It’s built to be repeatable, so you get the same device, connection and location on every run.
Field data comes from the Chrome User Experience Report, or CrUX. It’s collected from real Chrome users on whatever phone and network they have.
PageSpeed Insights shows you the previous 28 days of it at the 75th percentile. That means three out of four of your page loads were at that value or better.
Your page passes the Core Web Vitals assessment only if all three metrics are good at that percentile. If there isn’t enough INP data, LCP and CLS decide it on their own.
Two details can catch you out:
- CrUX only listens to some browsers. It collects from Chrome on desktop and Android. Chrome on iOS, Android apps using WebView and other Chromium browsers such as Edge aren’t in it.
- Quiet pages borrow numbers. If your page doesn’t get enough visits, PageSpeed Insights shows figures for your whole origin instead. The switch is easy to miss.
Why Lab and Field Results Disagree
Google’s own explanation is short: a lab test is a single device, connected to a single network, run from a single location.
Your real traffic is everything else. Here’s what usually pulls the two apart:
- Devices and networks. Your visitors’ phones may be faster or slower than the emulated one, and the lab can’t know your mix.
- Cache. Lab tests usually load with a cold cache. Returning visitors often have your CSS, scripts and images stored already.
- Back/forward cache. Pages restored from it load almost instantly, and those visits count in the field. Lab tests leave them out.
- Location. A lab run comes from one place. If you suspect your server, test whether your hosting is actually the problem before you touch the front end.
- Personalized content. Ads, A/B tests and logged-in views load different things for different visitors.
- Interaction. A lab load doesn’t scroll, tap or select text. Your visitors do all three.
Your field data also covers everything your page loads on those phones, the tags you use to measure visitors among them. Your analytics script runs on every page view, so it’s part of what your field numbers describe.
That’s the reasoning behind lightweight web analytics. Take this tracker, for example. Its full script comes to about 2 KB and carries the defer attribute, so it only runs once your page has been parsed.
Back to that list. Interaction is the biggest blind spot, and it’s why two of the three Core Web Vitals can look fine in your lab report and fail for real users:
One Test Page, Two Verdicts
The test page is a simple blog post on a local test server, mapped to example.com.
It has a hero image, 22 paragraphs, three content images, four ad slots, a newsletter box and a comments section.
Version one has three common mistakes you’ve probably seen before:
- Three lazy-loaded images with no width or height
- Ad slots and a newsletter box that get filled after the visitor scrolls to them, with no space kept for them
- A “Show all 600 comments” button that builds the whole list in one go
Version two fixes each one: the images get dimensions, the slots get reserved height, and the button shows a loading state before it builds the list in batches.
We ran each version through Lighthouse 13.5.0 five times with the default mobile settings and kept the median. We quote INP the way Lighthouse shows it, rounded to 10 ms.
Then we recorded a Lighthouse user flow on the same page: load it, scroll to the end, tap the button. The scrolling and the tap happen in a timespan, the Lighthouse mode that measures a stretch of real use.
Both versions get a perfect 100 on a standard run. Nothing in the page load tells them apart.
Once your visitor scrolls and taps, version one fails both metrics. CLS was 0.265 in all five runs, and INP ranged from 590 to 620 ms.
Lighthouse names the culprits too: its layout shift list for version one points at a lazy-loaded image and at paragraphs pushed down by late content.
The user flow is still a lab test, with one device, one network and one way of scrolling.
But it catches a class of problem that a page-load run can’t see at all.
Cumulative Layout Shift: The Shifts a Page Load Never Sees
What is cumulative layout shift? It’s a score for how much visible content moves unexpectedly while someone is using your page.
A CLS score of 0.1 or less is good, and anything above 0.25 is poor.
Shifts are grouped into bursts called session windows, with less than a second between shifts and five seconds at most. Your CLS is the worst burst.
Shifts within half a second of a tap, click or key press are excluded, since your visitor caused them. Scrolling doesn’t get that pass.
That’s the trap. A standard Lighthouse run only sees shifts during load, above the fold. Anything that moves after your visitor starts scrolling never reaches it.
The usual causes:
- Images and iframes without width and height, lazy-loaded ones especially
- Ads, embeds and banners injected with no space kept for them
- Web fonts that load late and reflow your text
Your fix is to tell the browser how much room to keep before the content arrives:
<img src="photo.jpg" width="800" height="450" loading="lazy" alt="Team photo">

<style>
    img { max-width: 100%; height: auto; }
    .ad-slot { min-height: 250px; }
</style>
Lazy loading isn’t the problem here, so you can keep it.
Just keep the dimensions on every image you lazy-load.
On our test page, those two changes took CLS after scrolling from 0.265 to 0.
Interaction to Next Paint: What a Page Load Can’t Measure
Interaction to Next Paint (INP) measures how long your page takes to show a response after a click, tap or key press.
It became a Core Web Vital in March 2024, replacing First Input Delay.
An INP of 200 ms or less is good, and above 500 ms is poor. Scrolling, hovering and zooming don’t count at all.
On most pages, your INP is simply the slowest interaction of the visit.
A standard Lighthouse run can’t measure it, because nothing gets clicked. Looking for Interaction to Next Paint in Lighthouse? You’ll only find it in a timespan.
The lab stand-in is Total Blocking Time (TBT), which adds up how long the main thread was blocked during load. Google calls TBT a reasonable proxy for INP in the lab, but not a substitute.
Our test page shows why: during page load, TBT was 0 ms on both versions, because the expensive work only starts when someone taps.
In version one, that tap built 600 comments in a single task. The next frame had to wait for all of it.
Version two does the same work in a different order:
- Show feedback first, so the button says “Loading comments…” right away
- Yield to the main thread so the browser can paint that frame
- Build the rest in batches of 50, yielding between batches
function yieldToMain() {button.addEventListener('click', async () => {
if (globalThis.scheduler?.yield) return scheduler.yield();
return new Promise(resolve => setTimeout(resolve, 0));
}
button.textContent = 'Loading comments…';
await yieldToMain(); // let the browser paint the feedback
for (let i = 0; i < comments.length; i += 50) {
list.append(...comments.slice(i, i + 50).map(renderComment));
await yieldToMain();
}
});
Same 600 comments, same total work. Yet INP dropped from 600 ms to 10 ms, because the first paint after the tap no longer waits for the list.
The scheduler.yield() API isn’t available in every browser yet, so keep the setTimeout fallback.
How to Check That a Page Speed Fix Actually Worked
A lot of website speed optimization advice ends at the lab score, but a fix you can’t confirm is a guess.
Here’s how to measure page speed after a change, first in the lab and then in the field.
In the lab: compare the median of five runs
Your page speed score moves between runs even when you haven’t changed anything. Network availability, your hardware and other work on the machine all add noise.
Lighthouse’s own documentation says the median of five runs is twice as stable as a single run.
- Run Lighthouse five times before the change and note the median
- Deploy one change at a time
- Run five more times with the same device and settings, then compare the medians
- For CLS and INP, also record a user flow that scrolls and taps
If you use Node, a user flow takes a few lines with Lighthouse and Puppeteer:
import fs from 'node:fs';import puppeteer from 'puppeteer';
import { startFlow } from 'lighthouse';
const browser = await puppeteer.launch();
const page = await browser.newPage();
const flow = await startFlow(page);
await flow.navigate('https://example.com/post');
await flow.startTimespan();
await page.mouse.wheel({ deltaY: 3000 });
await page.click('#show-comments');
await flow.endTimespan();
fs.writeFileSync('flow.html', await flow.generateReport());
await browser.close();
In the field: wait for the window to roll over
Your field data won’t confirm anything overnight.
The CrUX numbers in PageSpeed Insights cover a trailing 28 days and update daily. Old visits keep counting until they age out.
Take the worst case, where every visit before your fix was poor and every visit after it is good.
The 75th percentile only turns good once three quarters of the window comes from after the fix. At steady traffic, that’s day 21.
If most of your visits were already good, it happens sooner.
Search Console runs on the same clock: click Start Tracking after a fix, and it watches the issue for 28 days.
Your own field data: see it the same day
A month is a long wait. That’s why Google recommends you collect field data yourself, on top of CrUX.
This is real user monitoring (RUM), and Google’s web-vitals library turns the basic version into a few lines:
<script type="module">
    import { onCLS, onINP, onLCP } from 'https://unpkg.com/web-vitals@5?module';

    function send(metric) {
        navigator.sendBeacon('/vitals', JSON.stringify({
           name: metric.name, value: metric.value, page: location.pathname
        }));
    }

    onCLS(send);
    onINP(send);
    onLCP(send);
</script>
You’ll see real values from the first visit after you deploy. Split them by device and page type before you compare, because a fix for your mobile article pages disappears in a site-wide average.
Key Takeaways
If you’re working out how to improve page speed on your own site, here’s the short version:
- A green Lighthouse score describes one simulated page load. The Core Web Vitals assessment describes 28 days of real visits
- When the two disagree, Google’s advice is to prioritize the field data
- A standard Lighthouse run can’t measure INP and only sees CLS during load. Record a timespan to catch both
- Reserve space for anything that arrives late: images, ads, embeds, banners
- In click handlers, paint feedback first and yield before the heavy work
- Good site speed optimization is judged by medians in the lab and a full 28-day window in the field
Frequently Asked Questions4 FAQs
Quick answers to common questions about this topic
Lighthouse results vary with network conditions, hardware and other work on the test machine. Compare the median of five runs.
The assessment uses 28 days of field data from real Chrome users. Your score comes from one lab run, so a page can pass one and fail the other.
PageSpeed Insights runs Lighthouse for its lab section and adds CrUX field data on top. Lighthouse on its own gives you lab data only.
Google recommends good Core Web Vitals if you want to succeed in Search. It says they match what its ranking systems aim to reward.